
Sara Sorenson
Instructional Design / Product Enablement
I'm a lifelong learner, art and design aficionado, and proverbial geek dedicated to changing the world one awesome learning experience at a time.Want to hear me talk about some of my deeply rooted beliefs regarding effective learning? Check out this episode from Techsmith's Visual Lounge podcast:
eLearning
The Process of Elimination
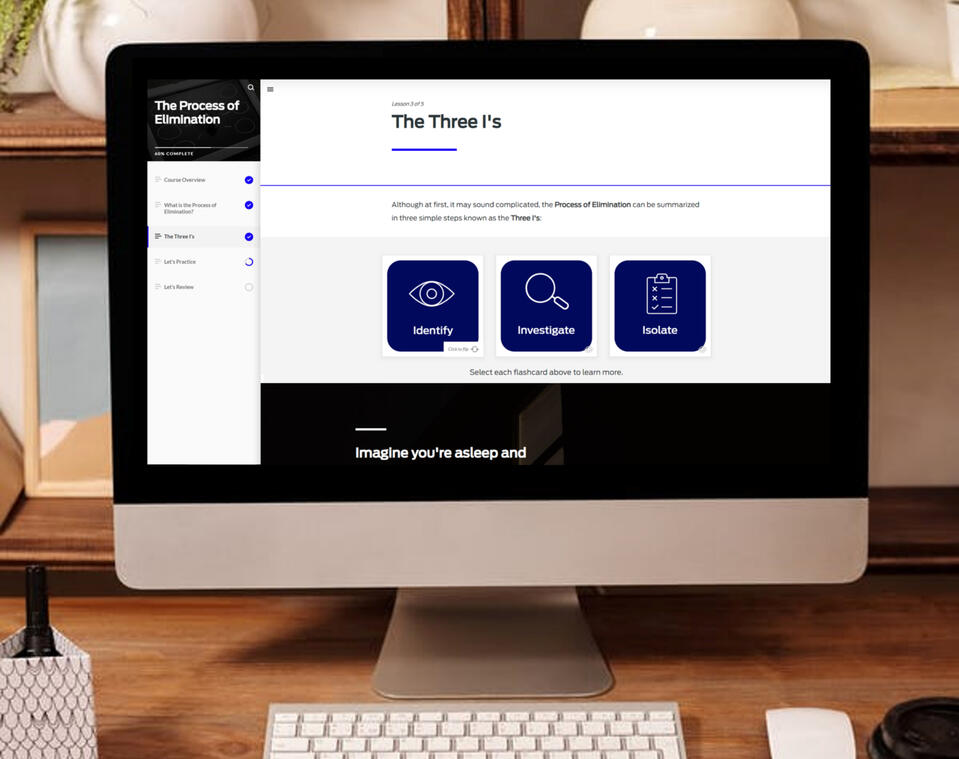
Tools used: Rise + Storyline 360 + PhotoshopThis soft skills course was designed to take the terror out of troubleshooting. The purpose was to focus first and foremost on the soft skills, rather than the technical aspects, required when troubleshooting mobile app issues. After its successful launch, this course was requested by multiple teams in other departments.Storyline was used to create an interactive practice game to allow learners to apply what they had learned in the Rise course and get immediate feedback on their skills.
Boolean Search Querdle (Prototype)
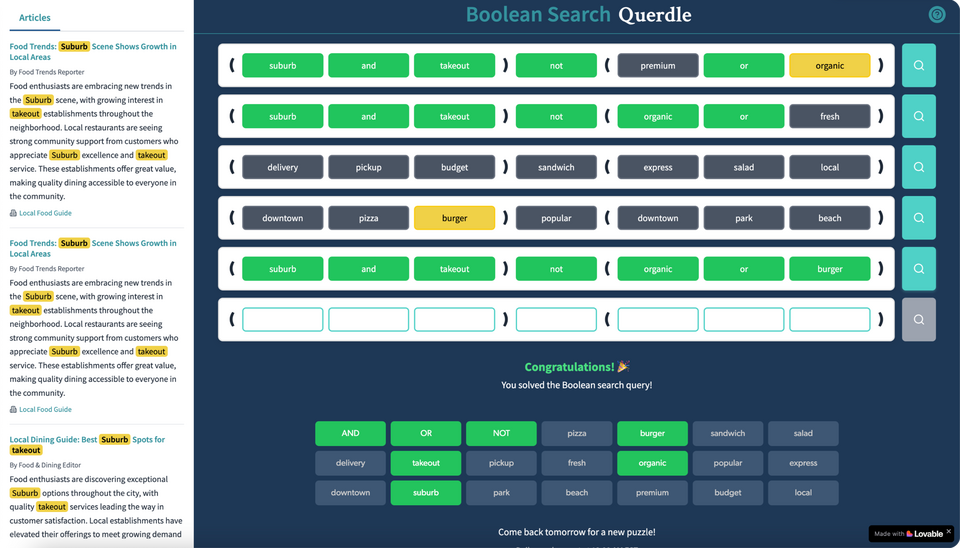
Tools used: Storyline 360 + LovableThis game was designed to help users build search literacy by mimicking the analysis that would be required when using the Search database in Muck Rack. Users are required to test the efficacy of their search queries by reviewing how they impact their article search results, and understand how different Boolean operators and keyword will impact those results.This fully functioning game prototype, inspired by the popular game Wordle, was originally mocked up using Storyline 360, then was built using Lovable.
Video
Anatomy of an Automobile Course Intro
Tools used: VyondThis video was used to introduce an eLearning course on the Anatomy of an Automobile. It was designed for entry-level employees who would join various teams supporting customers with questions and concerns about their vehicles.
Feature Spotlight Video
Tools used: Camtasia, Adobe Illustrator, WellSaid LabsThis video was created to introduce a new feature within the Muck Rack platform. Adobe Illustrator was used to create the graphics, WellSaid Labs was used to create the voiceover audio, and Camtasia was used to edit the video. These were then combined with animation using Camtasia and used within in-app messaging in the Muck Rack platform as well as within our Help Center articles and Muck Rack Academy video library.NOTE: This is only the introduction to the video as the full tutorial video contains proprietary information.
Job Aids
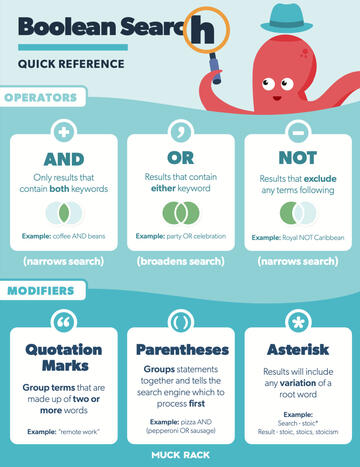
Boolean Quick Reference InfographicTools used: Adobe IllustratorThis infographic was created as a supplemental resource for the Boolean Basics course within Muck Rack Academy. The goal was to provide a branded quick reference guide that illustrates the differences between some of the basic Boolean operators and how they could be applied to searches within the Muck Rack database.
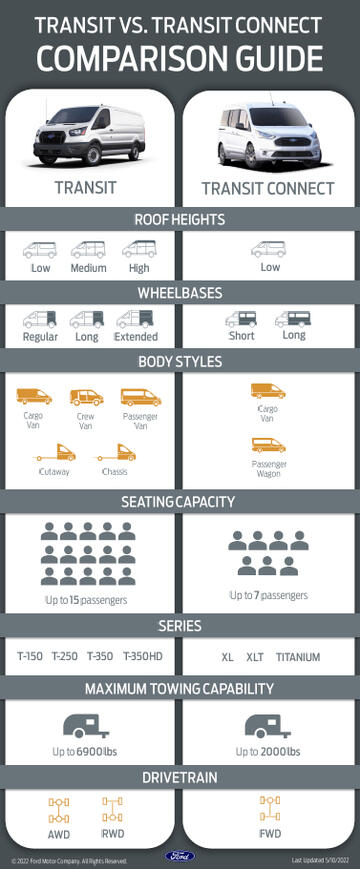
Vehicle Comparison InfographicTools used: Photoshop, PowerPointThis infographic was created as a quick reference document to consolidate information spread across multiple resources and make it easier for customer service representatives to answer questions about two commonly confused vehicles.Success was determined by comparing KPIs (such as handle time, CSAT scores, and QA scores) as well as interviewing team members and leaders before and after implementation.
In-App Support
Product Adoption via Customer Education
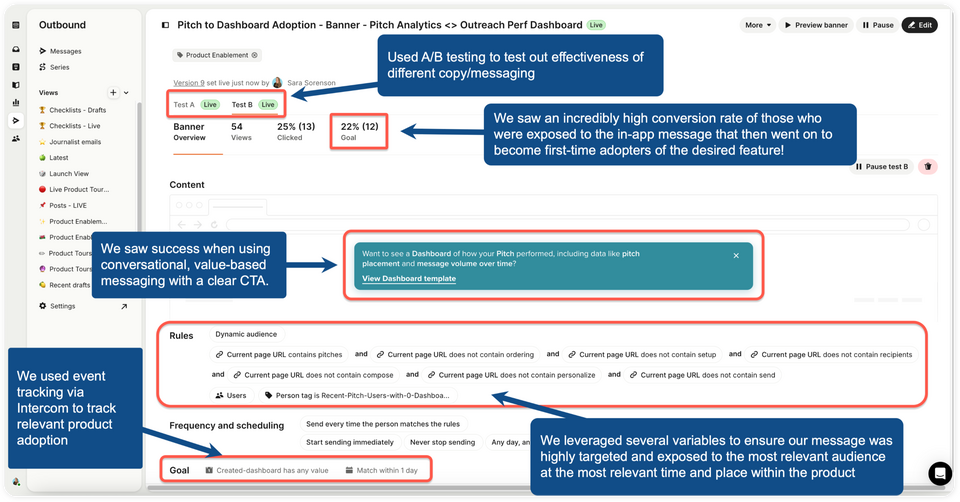
Tools used: IntercomThe Problem:Our Product team at Muck Rack (a SaaS company that serves PR professionals) wanted to see if we could help drive product adoption for our new Dashboard Templates feature after they weren't seeing the traction they wanted post-launch.The Strategy:For this initiative, we targeted users who had built objects that were relevant to specific templates and surfaced messaging that drove awareness of the feature and how it could add value to the features they were already using.The Solution:In this example, we surfaced a conversational, value-based message on the Pitches page where users would see their Pitch Analytics to let them know they could easily use a dashboard template to view deeper analytics on how their pitches were performing.By selecting the link in the banner, they would be taken directly to the Dashboard builder with the relevant template highlighted and have the option to take a tour to build the dashboard in less than 6 clicks.The Result:Using A/B testing, we were able to determine which style of copy within the banner text was most effective at driving adoption: conversational text that specifically listed the metrics that could be seen in the dashboard (based on research another department had done to determine which metrics PR pros find most valuable).We used several variables to ensure our message was highly targeted and exposed to the most relevant audience at the most relevant time and place within the product. Specifically, we wanted to target users who were actively using our Pitching feature but had never created a dashboard before.Finally, we were able to use event-based tracking within Intercom to track the most relevant action based on the behavior we wanted to drive: creating a dashboard. We were able to determine that 22% of users who viewed the banner went on to successfully create a dashboard.